
Vol. 40 (Number 16) Year 2019. Page 25
SUNCHALIN, Andrew M. 1; KOCHKAROV, Rasul A. 2; LEVCHENKO, Kirill G. 3; KOCHKAROV, Azret A. 4 & IVANYUK, Vera A. 5
Received: 25/02/2019 • Approved: 05/05/2019 • Published 13/05/2019
ABSTRACT: The relevance of the study is caused to the development of the financial market and the increasing of role in the economy. Any activity on the financial market poses risks of losses as a result of the influence of different factors. The most dangerous are market risks. An important stage in the management of market risks is their assessment. The market risk of a security paper depend on several factors: exchange rates, interest rates, oil prices, and other factors. One of the most recognized risk assessment methods is the value-at-risk (VaR). In the article is presented a practical example of risk management based on rebalancing. |
RESUMEN: La relevancia del estudio se debe al desarrollo del mercado financiero y al creciente papel en la economía. Cualquier actividad en el mercado financiero plantea riesgos de pérdidas como resultado de la influencia de diferentes factores. Los más peligrosos son los riesgos de mercado. Una etapa importante en la gestión de riesgos de mercado es su evaluación. El riesgo de mercado de un documento de seguridad depende de varios factores: tipos de cambio, tasas de interés, precios del petróleo y otros factores. Uno de los métodos de evaluación de riesgos más reconocidos es el valor en riesgo (VaR). En el artículo se presenta un ejemplo práctico de gestión de riesgos basado en el rebalanceo. |
The financial market is associated with risk. Risk depends on external and internal factors (Khalifa, Otranto, Hammoudeh, & Ramchander, 2016). The unfavorable impact of risks has negative influence on the profitability of big companies and private investors (Corbet, Dowling, & Cummins, 2015). The issue of investment risk management has become extremely relevant after several financial crises and stock market crashes (Jovanovic, 1987). Risk can be defined as possible danger which can occur as a result of making a decision, and its outcome is unclear and, likely, unsafe (Kenourgios, 2014).
Investment risk is defined as a possibility to suffer certain loss as a result of deviations of actual values of the observed phenomenon (e.g., portfolio return) from expected values (which were planned by the investor). There are two types of risks connected with the formation and management of security portfolio:
1. Systemic risk (market risk) — a part of an overall risk which depends on factors common to the whole security market (Keynes, 2018);
2. Unsystematic risk (unique risk) — a risk which occurs due to the fact that the issuer faces certain risks which are typical for him.
Systemic risk is also known as market risk and is conditioned by market reasons: country’s macroeconomic situation, level of economic activity on financial markets (Wallerstein, 2004):
Unsystematic risk can be mitigated through diversification.
Market risk mainly affects the trading (or market) portfolio. In fact, market risk is the risk that the net present value of a portfolio will decrease over the period required to liquidate the portfolio. There are three stages of risk management:
1) risk identification,
2) risk assessment,
3) risk management – development of risk management measures.
At the very first stage, the subject, the object and the implication of market risk are determined. The subject of market risk, that is, the one who will suffer losses, is the investor, the object of market risk or what the subject puts at risk is the investor's money, and the implication of risk is the failure to achieve the expected rate of return on a company's security.
The market risk of a company's security may depend on many factors: exchange rates, interest rates, changes in the market index, oil prices and other indicators (Choudhry, Papadimitriou, & Shabi, 2016). Their number is mainly determined by the market in which the company is located, not least because the factors can vary greatly from country to country (Shi, Ho, & Liu, 2016).

To assess market risks, the Value-at-Risk (VaR) methodology is currently used as a risk measure.
Various banks, Bank for International Settlements (BIS) in particular, use VaR as a basis for setting (Cooke Ratio) with regard to the risk of assets.
VaR helps:
- evaluate risk as a possible loss correlated with causes for occurrence;
- measure risks in different markets universally;
- aggregate individual risks into a single value for the whole portfolio, including information about the number of positions, market volatility, and correlations between assets.
VaR gives a probabilistic assessment of potential losses within a given time period under expertly set confidence level.
To calculate VaR it is necessary to determine a set of basic elements which affect its value. The variance-covariance method implies the normal (Gaussian) distribution of logarithmic returns of a zero average. However, this assumption is not usually fulfilled on a real market (Gauss, 1816).
Then, it is necessary to choose the confidence level, or the possibility when losses do not exceed the value of VaR. according to Basel III, VaR is calculated when the significance level is α = 0,01(Figure 1).
Figure 1
The maximum possible loss

The graph shows the situation that with the possibility X over N days the maximum possible losses account for the stroked area under the graph.
Next, we need to define the time horizon, or the period over which we estimate the risk of losses.
For instance, according to the Basel Committee on Banking Supervision (BCBS), the time horizon is 10 days. According to Risk Metrics methodology, it is 1 day. If there are no internal or external limitations when setting the time horizon, it is important to consider not only the characteristics of the investment portfolio but also factors as, for example, market liquidity.

Portfolio risk management methods include:
• Methods minimizing risk through the reduction of potential gains, search for information, risk evasion;
• Methods for compensation for losses which are the transfer of risk, risk control or its distribution.
The former methods include diversification and limitation — limited investment. Diversification helps reduce risk by adding securities so that the correlation of returns is lesser than one. If the correlation of returns is -1, it means that the risk of the portfolio approaches minimum. Only unsystematic risk is reduced through diversification; this risk is inherent to certain securities, and certain issuer. Consequently, the increased number of securities in the portfolio leads to the reduction of unsystematic risk.
The latter method includes hedging and insurance. Hedging is taking a position over futures in one market contrary to a position in another market to compensate cost risks (Shiller, 1993).
The most common mechanisms of hedging are futures contracts. Risk reduction through futures is based on the fact that if there are negative changes to the cost of an asset at the moment of delivery, the bidder can compensate for them in equal amount through buying contracts of the equivalent number of assets, and vice versa. Hedging with futures helps set the price of an asset today, as well as interest rate and exchange rate, and the contract will be fulfilled at a predetermined time. The central notion in insurance by futures contracts is hedge ratio which is used to calculate the optimal number of futures contracts needed to be purchased or sold.
In complete hedging the formula is

If the investor is sure about his predictions about the future development of the market situation, the contract is signed. However, if predictions are flawed, or if there are occasional deviations, the investor may suffer great losses. In order to mitigate financial risk investor should address an option contract which is a flexible tool of trade and risk management. This type of insurance is based on a deal with a ‘premium’ (option) which is paid for having a right to realize or purchase a stated asset over the given time period in a certain amount and at a certain predetermined price. There are two types of options:
1. Call options — options to purchase, gives the right to buy an asset;
2. Put options — options to sell, gives the right to sell the underlying asset.
Options are divided into European-style options (to be exercised on a predetermined date) and American-style options (to be exercised at any time before the contract expires). There are rules for hedging with options: in order to insure asset from the price fall a put option should be bought and a call option should be sold. If the position is insured from the price rise, a put option should be sold and a call option should be bought. Thus, by buying put options it is possible to hedge long positions, and short positions — by call options.
By combining different options it is possible to create hedging strategies. A warrant is a type of options. It is a contract on buying a certain number of shares (share warrant) or bond (bond warrant) at a fixed price at any time until the expiration date. The time to expire can be indefinite, or it can be longer than in regular options.
Hedging can be executed with swaps. A swap is a contract which implies an exchange of different assets when there is simultaneous buying and selling of financial instrument.
Along with risk management methods based on diversification and hedging, the rebalancing method is used in practice to reduce investment portfolio risks.
The aim of traditional rebalancing is to change the current distribution of portions of assets in the portfolio in order to ensure maximum portfolio yield, or in order to ensure that portfolio risk is minimal. A strategy based on rebalancing is one of four main dynamic strategies of distribution of portions of assets. Other three strategies are Buy-and-Hold, Constant-Proportion, and Option-Based Portfolio Insurance.
Now we will build a rebalanced minimal risk investment portfolio which consists of shares of three largest companies: FedEx Corporation, J.P. Morgan & Co, Microsoft Corporation. The original data and the daily yield are given in the Table 1.
Table 1
Calculation of daily return on assets included in the portfolio
Data |
FDX-1 |
JPM-2 |
MSFT-3 |
FDX |
JPM |
MSFT |
05.01.2016 |
143,43 |
63,62 |
55,05 |
Profit |
Profit |
Profit |
06.01.2016 |
144,65 |
63,73 |
54,05 |
0,85% |
0,17% |
-1,82% |
07.01.2016 |
140,77 |
62,81 |
52,17 |
-2,68% |
-1,44% |
-3,48% |
08.01.2016 |
134,59 |
60,27 |
52,33 |
-4,39% |
-4,04% |
0,31% |
11.01.2016 |
134,71 |
58,92 |
52,3 |
0,09% |
-2,24% |
-0,06% |
12.01.2016 |
132,97 |
58,83 |
52,78 |
-1,29% |
-0,15% |
0,92% |
13.01.2016 |
134,71 |
58,96 |
51,64 |
1,31% |
0,22% |
-2,16% |
14.01.2016 |
130,29 |
57,34 |
53,11 |
-3,28% |
-2,75% |
2,85% |
15.01.2016 |
131,7 |
58,2 |
50,99 |
1,08% |
1,50% |
-3,99% |
19.01.2016 |
126,92 |
57,04 |
50,56 |
-3,63% |
-1,99% |
-0,84% |
20.01.2016 |
127,2 |
57,01 |
50,79 |
0,22% |
-0,05% |
0,45% |
21.01.2016 |
123,18 |
55,51 |
50,48 |
-3,16% |
-2,63% |
-0,61% |
The risk of the investment portfolio is calculated based on the model by H. Markowitz, according to formulas 1-2

Rebalancing will be carried out once a month or on a signal. There is such a need when the risk of a rebalanced portfolio is higher than of a non-rebalanced one. In this case, rebalancing is carried out with reference to the criterion of minimizing the portfolio risk until the non-negative income is reached. Table 2 shows the risk calculation of the investment portfolio.
Table 2
Portfolio risk
Data |
Portfolio risk |
Profitability |
|
Model of Markowitz |
Rebalancing model |
portfolio |
|
24.05.2016 |
3,59% |
3,59% |
0,13% |
25.05.2016 |
3,56% |
3,56% |
0,14% |
26.05.2016 |
3,59% |
3,59% |
0,12% |
27.05.2016 |
3,69% |
3,69% |
0,13% |
31.05.2016 |
3,75% |
3,75% |
0,17% |
01.06.2016 |
3,80% |
2,80% |
0,10% |
02.06.2016 |
3,84% |
2,82% |
0,11% |
03.06.2016 |
3,90% |
2,82% |
0,13% |
06.06.2016 |
3,98% |
2,81% |
0,12% |
07.06.2016 |
3,94% |
2,72% |
0,13% |
08.06.2016 |
3,93% |
2,65% |
0,13% |
09.06.2016 |
3,88% |
2,55% |
0,15% |
10.06.2016 |
3,73% |
2,42% |
0,08% |
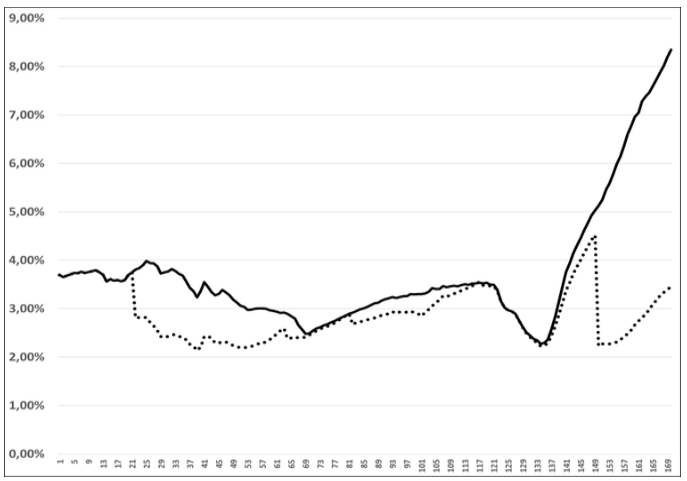
Figure 3 shows the contrast between the portfolio risk without rebalancing and the portfolio risk with rebalancing. The risk of a portfolio with the rebalancing marked by a dotted line, the risk of a portfolio without rebalancing marked by a solid line.
The average risk of a non-rebalanced portfolio is 3,743%, and the average risk of a rebalanced portfolio is 2, 895%.
Figure 3
The rebalanced portfolio risk, and the non-rebalanced portfolio risk

Therefore, risk assessment is an important element in portfolio management. It was conducted a comparative analysis of the two strategies: rebalancing strategy and strategy based on G.Markovits model. Strategy based on rebalancing model was showed best results.
This work was supported by the Russian Foundation for Basic Research (Grant № 18-00-01103, Grant № 17-06-00577).
Choudhry, T., Papadimitriou, F. I., & Shabi, S. (2016). Stock market volatility and business cycle: Evidence from linear and nonlinear causality tests. Journal of Banking & Finance, 66, 89-101.
Corbet, S., Dowling, M., & Cummins, M. (2015). Analyst recommendations and volatility in a rising, falling, and crisis equity market. Finance Research Letters, 15, 187-194.
Gauss, C. F. (1816). Bestimmung der genauigkeit der beobachtungen. Abhandlungen zur Methode der kleinsten Quadrate, 1887.
Jovanovic, B. (1987). Micro shocks and aggregate risk. The Quarterly Journal of Economics, 102, 395-409.
Kenourgios, D. (2014). On financial contagion and implied market volatility. International Review of Financial Analysis, 34, 21-30.
Keynes, J. M. (2018). The general theory of employment, interest, and money. Springer.
Khalifa, A. A., Otranto, E., Hammoudeh, S., & Ramchander, S. (2016). Volatility transmission across currencies and commodities with US uncertainty measures. The North American Journal of Economics and Finance, 37, 63-83.
Shi, Y., Ho, K.-Y., & Liu, W.-M. (2016). Public information arrival and stock return volatility: Evidence from news sentiment and Markov Regime-Switching Approach. International Review of Economics & Finance, 42, 291-312.
Shiller, R. J. (1993). Aggregate income risks and hedging mechanisms. Tech. rep., National Bureau of Economic Research.
Wallerstein, I. M. (2004). World-systems analysis: An introduction. Duke University Press.
1. Candidate of Physical and Mathematical Sciences, Associate Professor of the Department of Data Analysis, Decision Making and Financial Technologies Financial University under the Government of the Russian Federation, Moscow, Russian Federation; Bauman Moscow State Technical University, Moscow, Russian Federation. Contact e-mail: AndreySunchalin@mail.ru
2. Candidate of Economic Sciences, Associate Professor of the Department of Data Analysis, Decision Making and Financial Technologies Financial University under the Government of the Russian Federation, Moscow, Russian Federation. Contact e-mail: akochkar@gmail.com
3. Candidate of Physical and Mathematical Sciences, Associate Professor of the Department of Data Analysis, Decision Making and Financial Technologies Financial University under the Government of the Russian Federation, Moscow, Russian Federation. Contact e-mail: imaths@yandex.ru
4. Candidate of Physical and Mathematical Sciences, Associate Professor of the Department of Data Analysis, Decision Making and Financial Technologies Financial University under the Government of the Russian Federation, Moscow, Russian Federation. Contact e-mail: akochkar@gmail.com
5. Candidate of Economic Sciences, Associate Professor of the Department of Data Analysis, Decision Making and Financial Technologies Financial University under the Government of the Russian Federation, Moscow, Russian Federation. Contact e-mail: ivaver6@gmail.com