

Vol. 38 (Nº 59) Year 2017. Page 13
Gabriel PIÑERES-ESPITIA 1; Alejandro CAMA-PINTO 2; Daniel DE LA ROSA Morrón 3; Francisco ESTEVEZ 4; Dora CAMA-PINTO 5
Received: 08/08/2017 • Approved: 05/09/2017
ABSTRACT: The aim of this research is to develop a secondary weather station prototype for measurements of temperature, humidity and atmospheric pressure. To validate the operation, a variance analysis and an experimental design r&R were conducted. The TMP36, RHT03 and BMP085 sensors were selected for Arduino UNO platform and calibrated with a weather station and a digital hygrometer certifies by the authorities. Our system uses open hardware and software and is a low cost weather station designed for environmental analysis. |
RESUMEN: El objetivo de esta investigación es desarrollar un prototipo de estación meteorológica secundaria para mediciones de temperatura, humedad y presión atmosférica. Para validar la operación, se realizó un análisis de varianza y un diseño experimental r&R. Los sensores TMP36, RHT03 y BMP085 fueron seleccionados para la plataforma Arduino UNO y calibrados con una estación meteorológica y un higrómetro digital certificado por las autoridades. Nuestro sistema utiliza hardware y software abiertos y es una estación meteorológica de bajo costo diseñada para el análisis ambiental. |
Knowledge about climate behavior and its prediction is vital in order to prevent ecological, economic and social damage. For this reason, this is an issue that is responsibility for government, trade, agriculture, and other range of entities that are interested in knowing how climate can affect them (Fridzon et al., 2009; Abistado et al., 2014; Palmer, 2014;). In the agriculture case, it is vital to predict climate variables that have a significant influence on the product, such as periods of rainfall or lack of it, even when it is one of the most difficult variables to determine due to the nature of the atmospheric processes (Antolik, 2000; Fedele et al, 2014; McIntosh et al, 2007). It is necessary to help farmers to provide them a basis for making decisions (Ghile and Schulze, 2009; Mishra et al., 2013), especially in crops that depend solely on rain, such as the rainfed agriculture (Zinyengere et al, 2011; Peng et al, 2014). On the other hand, climate monitoring in cities is important in applications focused on early warning systems to detect events such as flash floods, tornadoes, flood risk and forest fires (Cama-Pinto et al, 2016; Azmil et al, 2015).
Widespread use that it is given to meteorology stations for measure or prediction in zones destined to agriculture (Doeswijk and Keesman, 2005; Montoya et al., 2013) has suffered an increase nowadays, largely due to worry about global climate change and phenomena like heat and cold waves, flooding, storms and strong wind affect crops and people's health negatively (De Sario et al., 2013; Borick and Rabe, 2014; Meléndez et al, 2017), produced, mainly, due to the greenhouse emissions that are causing a rise in sea level and also a decrease of ice in the Polar Regions (Ford et al., 2014; Liu et al., 2014). However, this phenomenon doesn't only affect to the increase in temperature, also in a contrary way, it produces big disasters by freezing (Zhang et al., 2013). In fact, nowadays, it is being given more importance to study the meteorology in other points on earth, as the Antarctic Continent, jungle regions from North Africa or South America's Amazon jungle, whose vegetation plays a vital role in global climate (Geissler and Masciadri, 2006; Cama et al., 2013; Schmidt et al., 2014).
For this reason, and having in mind the advances in electronic and construction of sensors and transducers, this research has developed an embedded prototype which gives a suitable management for analysis and acquire environmental information in order to obtain advantages in crops managing, displaying several of these stations in areas within a region with different microclimates (Catania et al., 2013), whose density is determined by the number of environmental factors to be monitored and its spatial variations (Ndzi et al., 2014). This device is an open development platform, has all kind of functions that make the information management an easier process, allowing be a important alternative for that an integral device manages all needed variables to supervise the measurement and predict atmospheric and climatic events and use collected data to elaborate predictions as of numerical models. This fact means that the cost of the device is less than other commercial devices. Therefore, it makes far easier the design, and also the project budget can be lower.
Nevertheless, academic world has had limited researches about sensors, due to the high cost of this kind of devices (Anzalone et al., 2013). Therefore, it appears the necessity of set out new possibilities of studying about open hardware platforms like Arduino. Its development environment is well known and due to this fact, is one of the most frequent choices for developing project of monitoring systems. For example: images monitoring, measure electric current in a Smart Grid, supervision of variables environmental in agronomy, measure the temperature in greenhouses or measure humidity levels in the ground of cultivated fields (Yu et al., 2014; Sung et al., 2014, Cama et al 2017), measure the temperature, humidity, air quality in industrial sectors, inclusive in applications for immersive virtual environment (Comas-Gonzalez et al, 2016). Because of this, in this paper we proposed a evaluation of a Synoptic Meteorological Station named “Open Forecast”, using static analysis through of ANOVA and an r&R experiment design. These analyze the conditions for the proof in the selection of the sensors implementation in the Station.
To accomplish the increased demand for agricultural products due to the growing world population, are necessary new ways to make existing agricultural processes more efficient (Kaloxylos et al, 2012; Blank et al, 2013), being one of them, the meteorological knowledge that influence over the crops. Therefore, in our work we have designed a meteorological station "Open Forecast" applying experimental design technique on Arduino platform (Arduino, 2014), with aim to obtain a complete measurement of the main environmental variables used in agriculture: temperature, humidity and atmospheric pressure (Michaels, 1982; Coelho and Costa, 2010; Luo et al., 2014).
The rest of this paper is organized as follows: the section 2 explains the methodology for the work development. The section 3 shows the results obtain with the application of the experimental design for the selection of the sensors. Finally, the conclusions are described.
This section shows the methodology for the selection of sensors to work with the Arduino platform in order to design a low-cost synoptic meteorological station through an ANOVA and r&R experimental design. The station will be used as a support tool in environmental measurement tasks applied to agriculture and Internet of Things (IoT). For this, climate-related variables such as temperature, relative humidity and atmospheric pressure are chosen, because those variables are the most used and also, allow synthesizing the climate behaviour of a region. Besides of that, this information matches with a type of weather station called synoptic station (Varfi et al., 2009; Yan et al., 2009; Kousari et al., 2011).
The criterion to select Arduino UNO platform were the attributes for the project target (processor speed, available memory, energy consumption, etc) and the circuits and ports for the connection of external devices (sensors, GSM modems, etc) required for each specific project. The main reasons to choose them are: a small price of implementation and installation, a high compatibility (several different shields), open licenses and multiplatform software (based on Processing). This device differs from the main family, because it includes a MOSFET chip that can supply power by an auto selection system (DC/USB). Moreover Arduino UNO devices have a boot loader (OptiBoot) that allows loading programs up to 115 Kbps and it uses only 512 Bytes, maximizing the memory using.
For the test and verification process of the data, Vantage Pro2 (Vantage, 2012) was chosen, because it is the weather station at the “Universidad de la Costa”. This dispositive has wireless transmission up to 300 mts and it is powered outside with solar energy. This use WeatherLink software through USB or RS232. It has a programmable data logger until 120 minutes, a storage capacity of 2560 data sets and the possibility to generate additional sensors' registers. Vantage pro 2 make measurements of ambient variables such as temperature: from -40º to + 65ºC (± 0.5º); Humidity: from 0 to 100% (± 3%); Pressure: from 540 to 1100 (± 1.0 hPa); Windspeed: from 3 to 241 km / h (± 5%); Direction: from 0º to 360º (± 4º); Rainfall: from 0 to 9999 mm/d.
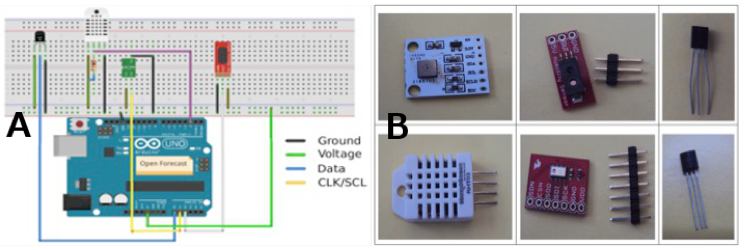
For the sensors in the market, several parameters were kept in mind, like if they could be so digital or analogical sensors; also if they are popular on the market, which means, easy to acquire. Because a medium price with high reputation in its results ensures a minimum costs with high quality. The table 1 describe the sensors features analyzed on a previous stage (Figure 1), before deciding which ones are finally the chosen for this prototype.
Figure 1
A. Sensors connection on Arduino platform. B. Sensors used for the selection.
-----
Table 1
Characteristics of sensors to be evaluated
Variable |
Sensor |
Operating Voltage |
Accuracy |
Operating Current |
Measurement Range |
Temperature |
TMP36 |
2.7 V to 5.5 V |
+/- 2º C |
< 50 μA |
-40ºC to 125ºC |
MCP9700 |
2.3 V to 5.5 V |
+/- 2º C |
6 - 12 μA |
-40ºC to 125ºC |
|
RTH03 |
3.3 V to 6 V |
+/- 0.2º C |
1 - 1.5 mA |
-40ºC to 125ºC |
|
Humidity |
RTH03 |
3.3 V to 6 V |
+/- 2 % |
1 - 1.5 mA |
0 to 100 % |
HIH4030 |
4 V to 5.8 V |
+/- 3.5 % |
200 - 500 μA |
0 to 100 % |
|
Barometric |
BMP085 |
3.3 V to 6 V |
+/- 1 hPa |
650 - 1000 μA |
300 to 1100 Kpa |
MPL115A1 |
2.37 V to 5.5 V |
+/- 1 KPa |
3 - 10 μA |
50 to 115 Kpa |
For a scientific evaluation that allows the selection of the sensors, which present better performance in their measurements together with Arduino UNO, an analysis of variance (ANOVA) and a r&R experimental design by to determine if there is a statistically significant difference was suggested. To establish whether a sensor provides better performance than the other, according to the important factors established to compare them. For this experiment, 100 repetitions were carried out at different times in order to average the samples needed to validate the study performed.
For this step, the samples cycle is started in order to select the sensors with a better performance against the weather station. Initially, to analyze this behavior and know how to be grouped sensors and allowing to establish the randomization of the tests, it was made a design of experiments 2^k factorial, using the software tool Minitab v16 with factor 3, factor level of 5.2.2, 100 executions of the experiment and 5 repetitions, giving the results reported in Table 2:
Table 2
Description of 2k factorial experimental design.
Factor |
Name |
Levels |
A |
Sensor_Temp |
"MCP9700" "TMP36" "RHT03" "MPL115A1" "BMP085" |
B |
Sensor_Pressure |
"BMP085" "MPL115A1" |
C |
Sensor_Humidity |
"RHT03" "HIH4030" |
Subsequently, the samples are prepared to verify a normal operation that delivers remarks about the results obtained from the sensors:
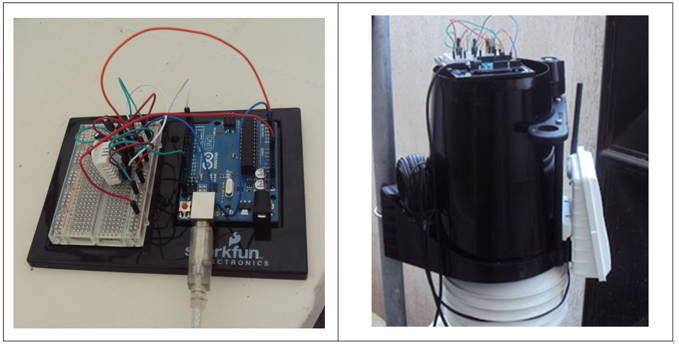
Because of this, modifications were made to sensor codes that had drawbacks in measurements. Also, the temperature measurement from the barometric sensors (BMP085, MPL115A1) was discarded. After, data blocks were sampled, allowing assessment of controllable design factors (internal heating and voltage differences) and uncontrollable (altitude, climate and environmental conditions). So that's not deliberately controlled factors influenced on response of the most interesting variables for the experiment (temperature, humidity and atmospheric pressure). Later, was applied the variance's analysis (ANOVA) to determine variability between the measurements and nominal factor. A new session of samples was organized as shown in Figure 2.
Figure 2
Equipment used in sample stage. Left: Prototype with Arduino (v0.1).
Right: Prototype with Arduino (v0.1) vs Vantage Pro2
For this new test day, the sensors were distributed into five blocks, each with 6 iterations in one-minute intervals, generating the values shown in Table 3 and Table 4.
Table 3
Temperature samples on the Open Forecast and Vantage Pro 2 Station
SENSOR |
Time |
Sample Number (in min.) |
Average |
|||||
1 |
2 |
3 |
4 |
5 |
6 |
|||
RHT03 |
10:15 a.m. |
33,5 |
31,3 |
33,6 |
34,7 |
34,3 |
34,8 |
33,7 |
TMP36 |
31,05 |
32,03 |
31,05 |
33,01 |
32,03 |
32,03 |
31,87 |
|
MCP9700 |
31,54 |
33,01 |
32,52 |
31,54 |
31,54 |
32,52 |
32,11 |
|
Vantage Pro 2 |
30,7 |
30,7 |
30,6 |
30,6 |
30,7 |
30,6 |
30,65 |
|
RHT03 |
10:22 a.m. |
33,2 |
34 |
34,6 |
34 |
34 |
33,9 |
33,95 |
TMP36 |
30,57 |
31,05 |
31,54 |
29,59 |
29,59 |
30,57 |
30,49 |
|
MCP9700 |
30,57 |
32,52 |
31,05 |
31,54 |
33,01 |
30,08 |
31,46 |
|
Vantage Pro 2 |
30,6 |
30,6 |
30,6 |
30,6 |
30,5 |
30,5 |
30,57 |
|
RHT03 |
10:29 a.m. |
34,6 |
33,8 |
33,7 |
33,9 |
34 |
33,6 |
33,93 |
TMP36 |
30,57 |
31,05 |
31,54 |
32,03 |
32,03 |
31,05 |
31,38 |
|
MCP9700 |
32,03 |
30,08 |
31,05 |
33,5 |
31,54 |
32,03 |
31,71 |
|
Vantage Pro 2 |
30,6 |
30,6 |
30,6 |
30,6 |
30,6 |
30,5 |
30,58 |
|
RHT03 |
10:35 a.m. |
34,1 |
34,9 |
34,3 |
34,1 |
34,8 |
35,2 |
34,09 |
TMP36 |
31,54 |
30,57 |
31,05 |
31,54 |
32,03 |
32,03 |
30,36 |
|
MCP9700 |
32,52 |
34,47 |
32,52 |
33,9 |
33,01 |
32,03 |
31,43 |
|
Vantage Pro 2 |
30,4 |
30,5 |
30,5 |
30,5 |
30,4 |
30,4 |
30,45 |
|
RHT03 |
10:42 a.m. |
35,4 |
35,7 |
36 |
36,2 |
37,5 |
37,5 |
33,83 |
TMP36 |
32,52 |
31,05 |
33,5 |
31,54 |
32,52 |
32,03 |
31,61 |
|
MCP9700 |
34,47 |
32,52 |
34,47 |
33,01 |
36,43 |
33,98 |
31,97 |
|
Vantage Pro 2 |
30,6 |
30,6 |
30,7 |
30,8 |
30,9 |
31 |
30,77 |
|
The beginning of the sampling system was performed 10 min after initialized (when was stabilized)
Table 4
Humidity samples on the Open Forecast and Vantage Pro 2 Station
SENSOR |
Time |
Sample Number (in min.) |
Average |
|||||
1 |
2 |
3 |
4 |
5 |
6 |
|||
HIH4030 |
11:09 a.m. |
15,9 |
18,23 |
18,79 |
19,57 |
16,98 |
19,46 |
18,16 |
RHT03 |
45,7 |
44,6 |
46 |
48,8 |
49,4 |
48,7 |
47,2 |
|
Station |
49 |
50 |
50 |
50 |
50 |
50 |
49,83 |
|
HIH4030 |
11:15 a.m. |
24,89 |
11,93 |
30,52 |
22,84 |
20,75 |
27,14 |
23,01 |
RHT03 |
47,1 |
47,5 |
47,8 |
46,9 |
48 |
47,4 |
47,45 |
|
Station |
50 |
50 |
50 |
50 |
50 |
50 |
50 |
|
HIH4030 |
11:21 a.m. |
26 |
19,79 |
21,55 |
18,8 |
19,99 |
18,87 |
20,83 |
RHT03 |
48,3 |
47,4 |
46,5 |
47,1 |
46,4 |
44,9 |
46,77 |
|
Station |
50 |
50 |
50 |
50 |
50 |
51 |
50,17 |
|
HIH4030 |
11:28 a.m. |
16,45 |
15,09 |
21,08 |
15,42 |
10,68 |
0,82 |
13,26 |
RHT03 |
43,6 |
43 |
46,4 |
46 |
43,9 |
41,7 |
44,1 |
|
Station |
51 |
51 |
51 |
51 |
51 |
51 |
51 |
|
HIH4030 |
11:34 a.m. |
7,23 |
5,59 |
7,05 |
17,2 |
8,52 |
15,6 |
10,2 |
RHT03 |
41,6 |
42,5 |
42,7 |
45,2 |
44,3 |
43 |
43,22 |
|
Station |
50 |
50 |
50 |
50 |
50 |
52 |
50,33 |
|
The beginning of the sampling system was performed 10 min after initialized (when was stabilized)
For all the tests performed the atmospheric pressure measurements were the same and did not present fluctuations as in the other variables, due to effects such as maintaining the same altitude in the measurements. Accordingly, it is noteworthy that during the day of measurements both Vantage Pro2 Weather Station and the "Open Forecast" platform remained the same height, meaning thereby discarding the values of atmospheric pressure.
Upon finished the tests of the above section, the data for temperature sensors were arranged in the Minitab v16 statistical tool and generating the following ANOVA designs graphs, to be obtaining through the Fisher LSD method (Fig. 3). The means for each pair of factor levels and error rate of individual were compared with a significance level of 5% and a confidence level of 95%.
Fig. 3
Residual plot for temperature sensors
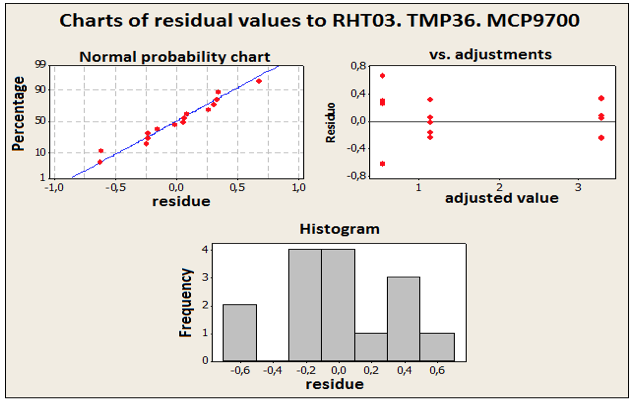
Upon analyzing the residual plot (Fig. 3) for the temperature sensors, a distribution three in one is presented, where in the first from left to right, is the normal probability of residues chart, followed by residues versus settings chart, and finally the histogram of residue. The normal probability of residue chart shows a straight line for the accuracy of the temperature sensors measurements, so it is valid to say that there is no evidence of non-normality, skew ness, outliers or unidentified variables. The residues versus the adjusted values chart shows that residues appear to be scattered randomly around zero. It is evident that there is no presence of non-constant variance, i.e. residues that increase or decrease with the adjusted values in a funnel-form pattern, missing terms or outliers. The histogram of residue shows the distribution of residue for every observation, and for the data about the accuracy of the temperature sensors, it can see that there is no skew ness or outliers.
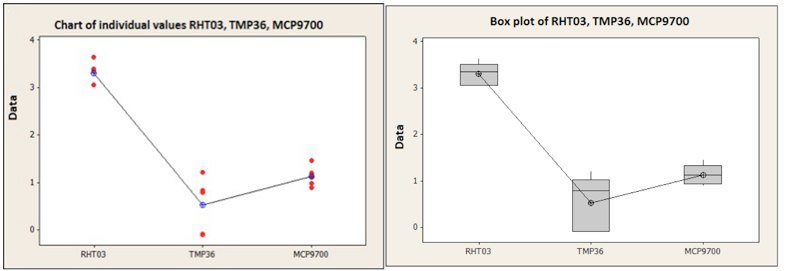
The analysis of graph 4 shows of individual data values and the box data of the temperature sensors:
Fig. 4
Individual values and box plot for temperature sensors
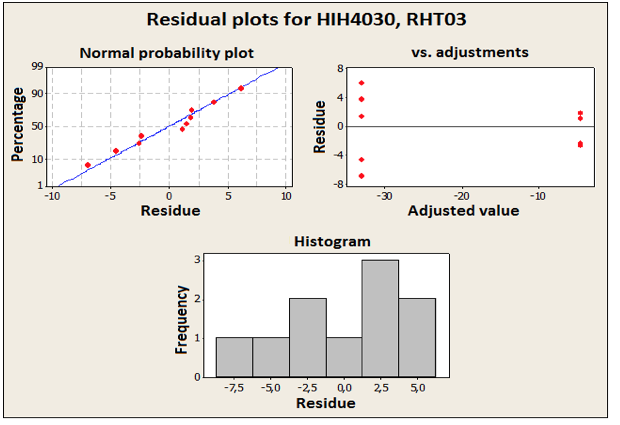
The residual chart for humidity sensors (Fig. 5) is obtained similarly, and a distribution three in one is presented, where the first from left to right, is the normal probability chart of residue, followed by residues versus settings chart and finally by the residue histogram.
The normal probability of residue chart shows that the accuracy of the humidity sensors measurements follows a straight line, so it is valid to say that there is no evidence of non-normality (data that deviate from a normal distribution.), skew ness, outliers or unidentified variables. The residues versus the adjusted values chart shows that residues appear to be scattered randomly around zero. It is evident that there is no presence of non-constant variance, i.e., residues that increase or decrease with the adjusted values in a funnel-form pattern, missing terms or outliers. The histogram of residue shows the distribution of residue for every observation, and for the data about the accuracy of the humidity sensors, it can see that there is no skew ness or outliers. It is important to consider the methods of regression and ANOVA applied, kept the following assumptions regarding the errors:
Fig. 5
Residual plot for humidity sensors
The fig 6 shows the individual data values of the humidity sensors charts and the data box charts and is analyzed:
Fig. 6
Individual values and box plot for humidity sensors

-----
Fig. 7
Graph Temperature and Humidity Sensors vs Station Vantage Pro 2
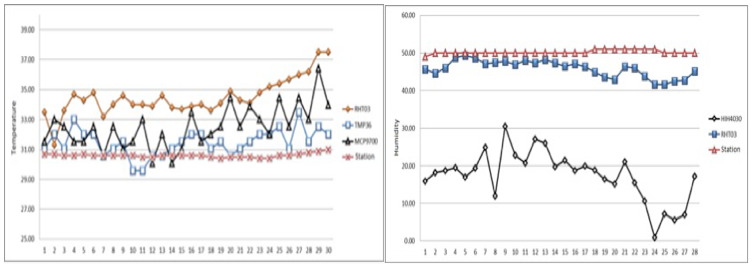
From the analysis of the condensed information of ANOVA designs made with the software Minitab and crossing data of the sensors and Vantage pro 2 Station (Figure 7), the selection of the TMP36 sensors for temperature measurement and the RHT03 sensor for measuring humidity are made. It is important to note that this selection is closely related to the analysis of the graphs provided by the design of experiments, mainly, graphs of individual values and graphs of boxes, since they are configured to work with small data sets, ensuring better responsiveness with respect to the statistical analysis of data. The sensor BMP085 was select for the Open Forecast due to libraries supplied by the manufacturer and a better fitting for the designed system. The statistical data not were considered, as explained above. This selection provides a weather station with the following limits or ranges, intrinsically to the physical or material of each sensor values:
To perform the calibration process a digital hygrometer from manufacturer Taylor was available, reference 1523 (Taylor, 2009), previously calibrated by a certified institute as the INCONTEC (Colombian Institute of Technical Norms and Certification), for the case Metrological Research for the Caribbean entity, METROCARIBE S.A, that evaluated all the regulatory and legal perspective to support the measurement and selection processes, so that they were able to reduce the variability of the results, guaranteeing performance and stability of the prototype Open Forecast.
For the analysis of the information an experimental design technique was proposed like the used in similar studies as in (Weber et al., 2014; Geng et al., 2013) and (D'Apuzzo et al., 2011). From such requirement, the R&R study (Evans et al., 2013) of the measurement system of the Minitab tool is implemented (Manivannan et al., 2010) in order to control the quality and monitor changes in critical processes, ie, help to identify problems that exist with the measurement system, and thus have a backup of the data or by failing to make real improvements in their processes. It is important to point, that the r&R studies determine it the inconsistencies in the measurement system are large enough to invalidate it (Low et al., 2009), and based on the set of parameters can be considered in detail the interpretation of the results shown in Figure 8:
In the Figure 8, it is important to note that for measurements the repeat and Reproducibility bars do not sum to the r&R study of the measuring system because these percentages are based on standard deviations, not variances. The R Graph it should be ensured that any point on the graph is not located above the upper control limit (UCL), hence confirming that the operator is measuring the parts uniformly. For the measurement by an operator determine whether the measurements and the variability between operators, this shows that are uniform. For the case above, operators can realize uniform measurements, ensuring similar measurements. The measurements by a part graph show average measurements by each operator for each part, showing that the averages vary significantly. This should occur because the parts chosen for study should represent the full range of possible parts. The following ranges of selection are taken into account:
Fig. 8
r&R of the measurement system for temperature variables
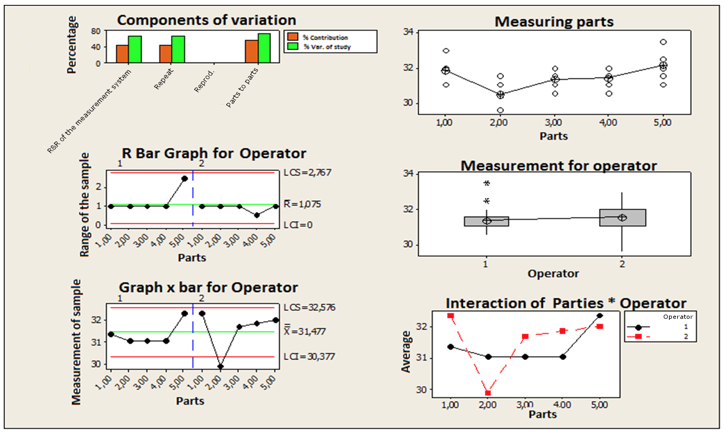
In the exposed case, the temperature variable characterization shows that the r&R of the total measurement is 3.750%, which allows the TMP36 sensor to be suitable for the implementation in the Open Forecast platform.
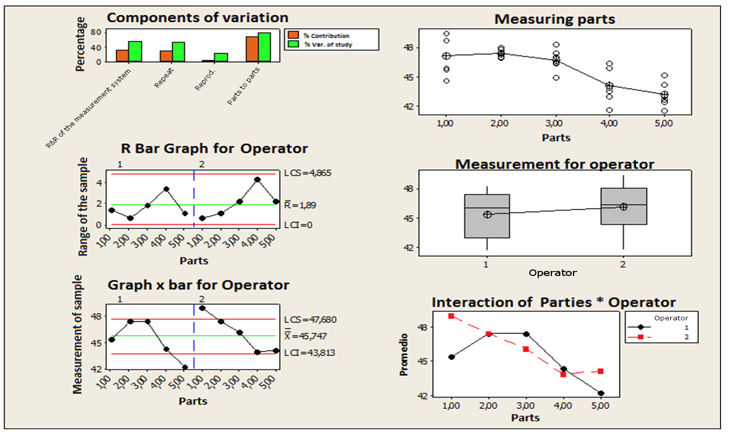
After the analysis of the data of the temperature variable, it continued with the interpretation of the RHT03 humidity variable as part of the sensor and the graphs presented in Figure 9 were obtained:
For the fig. 9, the components of variation graph indicate similarly that the Repeat and Reproducibility bars do not sum to the R&R study of the measuring system because these percentages are based on standard deviations, not variances. The measurements by part graph shows measurements-parts interaction that averages vary significantly. This should occur because the parts chosen for this study should represent the full range of possible parts. On the measurements by operator graph can be seen than the absence of outliers and the operators make uniform measurements, ensuring similar measurements. On the measurements by part indicate for the case exposed, the humidity variable characterization that the R&R of the total measurement is 7.0928%, which allows the RHT03 sensor to be suitable for the implementation in the Open Forecast platform.
Fig. 9
r&R of the measuring system for humidity variables
The aim of this research was to design and development a low cost weather station for environmental analysis. This paper discuss the elaboration of a high efficiency prototype that fulfills all the characteristics of a synoptic station by using three types of sensors for the measurement of the temperature, humidity and atmospheric pressure variables (TMP36 sensor, RHT03 sensor, BMP085 sensor respectively). The weather station was denominated “Open Forecast”, and it has a net value close to $75 USD with the advantages of using elements 100% open in their documentation, software and hardware guaranteeing that every interested person or institution can improve the system implementing or migrating it to the specific needs of the place or climatic zones. As it can be proved in this paper, the weather station was evaluated for 6 sensors (2 ambient temperature, 2 relative humidity and 2 atmospheric pressure) with a total net cost of round $125 USD, without taking into count the intrinsic difficulties of the materials and elaboration conflicts due to incompatibilities with the libraries provided by the manufacturers. Nevertheless after the determination of the principal design factors and the execution of the previously mentioned techniques and statistical studies, it was possible to reduce the variability of the answer, allowing saving 60% of the costs and improvements of performance and stability of the weather station. In order to continue and promote the development of this knowledge, details of the study have been recorded in a web (Open-Forecast Project, 2014). This study has highlighted implications for future weather stations in environmental studies on evaluating the effectiveness of these open systems.
Abistado, K.G., Arellano, C.N., Maravillas, E.A., 2014. Weather Forecasting Using Artificial Neural Network and Bayesian Network. Journal of Advanced Computational Intelligence and Intelligent Informatics 18(5), 812-816.
Antolik, M., 2000. An overview of the National Weather Service’s centralized statistical quantitative precipitation forecasts. Journal of Hydrology, 239, 306–337.
Arduino, 2014. Arduino-Home [Available on line, accessed oct 25, 2014]. < http://www.arduino.cc/ >.
Anzalone, G.C., Glover, A.G., Pearce, J.M., 2013. Open-source colorimeter. Sensors. 13(4), 5338-5346. < http://dx.doi.org/10.3390/s130405338 >.
Azmil, M. S. A., Ya'acob, N., Tahar, K. N. and Sarnin, S. S. Wireless fire detection monitoring system for fire and rescue application. 2015 IEEE 11th International Colloquium on Signal Processing & Its Applications (CSPA), Kuala Lumpur, 2015, pp. 84-89. doi: 10.1109/CSPA.2015.7225623.
Blank S., Bartolein, C., Meyer, A., Ostermeier, R., Rostanin, O., 2013. iGreen: A ubiquitous dynamic network to enable manufacturer independent data exchange in future precision farming. Computers and Electronics in Agriculture, 98, 109-116. < http://dx.doi.org/10.1016/j.compag.2013.08.001 >.
Borick, C.P., Rabe, B.G., 2014. Weather or not? Examining the impact of meteorological conditions on public opinion regarding global warming. Weather, Climate, and Society 6(3), 413-424. < http://dx.doi.org/10.1175/WCAS-D-13-00042.1 >.
Cama-Pinto, A., Piñeres-Espitia, G., Caicedo-Ortiz, J., Ramírez-Cerpa, E., Betancur-Agudelo, L. and Gómez-Mula, F. Received strength signal intensity performance analysis in wireless sensor network using arduino platform and xbee wireless modules. International Journal of Distributed Sensor Networks, 13(7):1550147717722691, 2017.
Cama-Pinto, A., Piñeres-Espitia, G., Zamora-Musa, R., Acosta-Coll, M., Caicedo-Ortiz, J., & Sepúlveda-Ojeda, J. (2016). Design of a wireless sensor network for monitoring of flash floods in the city of barranquilla, colombia. [Diseño de una red de sensores inalámbricos para la monitorización de inundaciones repentinas en la ciudad de Barranquilla, Colombia] Ingeniare, 24(4), 581-599.
Cama, A., Montoya, F.G., Gómez, J., De La Cruz, J.L., Manzano-Agugliaro, F., 2013. Integration of communication technologies in sensor networks to monitor the Amazon environment. Journal of Cleaner Production 59,32-42. < http://dx.doi.org/10.1016/j.jclepro.2013.06.041 >.
Catania, P., Vallone, M., Lo Re, G., Ortolani, M., 2013 A wireless sensor network for vineyard management in Sicily (Italy). Agricultural Engineering International: CIGR Journal, 15(4), pp.139-146.
Coelho, C., and Costa, S., 2010. Challenges for integrating seasonal climate forecasts in user Applications. Current Opinion in Environmental Sustainability, 2, 317-325. < http://dx.doi.org/10.1016/j.cosust.2010.09.002 >.
COMAS-GONZÁLEZ, Z., ECHEVERRI-OCAMPO, I., ZAMORA-MUSA, R., Velez, J., Sarmiento, R., & Orellana, M. (2017). Tendencias recientes de la Educación Virtual y su fuerte conexión con los Entornos Inmersivos. Revista ESPACIOS, 38(15). Retrieved from: http://revistaespacios.com/a17v38n15/17381504.html
D’Apuzzo, M., D’Arco, M., Pasquino, N., 2011. Design of experiments and data-fitting techniques applied to calibration of high-frequency electromagnetic field probes. Measurement (44), 1153-1165. < http://dx.doi.org/10.1016/j.measurement.2011.03.007 >.
De Sario, M., Katsouyanni, K., Michelozzi, P., 2013. Climate change, extreme weather events, air pollution and respiratory health in Europe. European Respiratory Journal 42(3), 826-843. < http://dx.doi.org/10.1183/09031936.00074712 >.
Doeswijk, T.G., Keesman, K.J., 2005. Adaptive weather forecasting using local meteorological information. Biosystems Engineering 91(4), 421-431. < http://dx.doi.org/10.1016/j.biosystemseng.2005.05.013 >.
Evans, K. Lou, E., Faulkner, G., 2013. Optimization of a Low-Cost Force Sensor for Spinal Orthosis Applications. IEEE Transactions on Instrumentation and Measurement 62, 3243-3250. < http://dx.doi.org/10.1109/TIM.2013.2272202 >.
Ford, J.D., McDowell, G., Jones, J., 2014. The state of climate change adaptation in the Arctic. Environmental Research Letters 9(10), number 104005. < http://dx.doi.org/10.1088/1748-9326/9/10/104005 >.
Fedele, A., Mazzi, A., Niero, M., Zuliani, F., Scipioni, A., 2014. Can the Life Cycle Assessment methodology be adopted to support a single farm on its environmental impacts forecast evaluation between conventional and organic production? An Italian case study. Journal of Cleaner Production, 69, 49-59. < http://dx.doi.org/10.1016/j.jclepro.2014.01.034 >.
Fridzon, M.B., Ermoshenko, Yu.M., 2009. Development of the specialized automatic meteorological observational network based on the cell phone towers and aimed to enhance feasibility and reliability of the dangerous weather phenomena forecasts. Russian Meteorology and Hydrology 34(2), 128-132. < http://dx.doi.org/10.3103/S1068373909020101 >.
Geissler, K., Masciadri, E., 2006. Meteorological parameter analysis above Dome C using data from the European centre for medium-range weather forecasts. Publications of the Astronomical Society of the Pacific 118(845), 1048-1065.
Geng, Z., Yang, F., Li, M., Wu, N. 2013. A bootstrapping-based statistical procedure for multivariate calibration of sensor arrays. Sensors and Actuators B: Chemical 188, 440-453. < http://dx.doi.org/10.1016/j.snb.2013.06.037 >.
Ghile, Y., Schulze, R., 2009. Use of an Ensemble Re-ordering Method for disaggregation of seasonal categorical rainfall forecasts into conditioned ensembles of daily rainfall for hydrological forecasting. Journal of Hydrology, 371, 85-97. < http://dx.doi.org/10.1016/j.jhydrol.2009.03.019 >.
Kaloxylos, A., Eigenmann, R., Teye, F., Politopoulou, Z., Wolfert, S., Shrank, C., Dillinger, M., Lampropoulou, I., Antoniou, E., Pesonen, L., Nicole, H., Thomas, F., Alonistioti, N., Kormentzas, G., 2012. Farm management systems and the Future Internet era. Computers and Electronics in Agriculture, 89, 130-144. < http://dx.doi.org/10.1016/j.compag.2012.09.002 >.
Kousari, M.R., Zarch, M.A.A., 2011. Minimum, maximum, and mean annual temperatures, relative humidity, and precipitation trends in arid and semi-arid regions of Iran. Arabian Journal of Geosciences 4(5), 907-914. < http://dx.doi.org/10.1007/s12517-009-0113-6 >.
Liu, C., Anuruddha, T.A.S., Minato, A., Ozawa, S., 2014. Development of portable CO2 monitoring System. 2nd Global Conference on Civil, Structural and Environmental Engineering, GCCSEE, Shenzhen, China, 838-841, 2547-2551. < http://dx.doi.org/10.4028/www.scientific.net/AMR.838-841.2547 >.
Low, M., Lee, Y., Yong, K., 2009. Application of GR&R for productivity improvement. Conference Electronics Packaging Technology EPTC 996-999. < http://dx.doi.org/10.1109/EPTC.2009.5416396 >.
Luo, Y., Chang, X., Peng, S., Khan, S., Wang, W., Zheng, Q., Cai, X., 2014. Short-term forecasting of daily reference evapotranspiration usingthe Hargreaves–Samani model and temperature forecasts. Agricultural Water Management, 136, 42-51. < http://dx.doi.org/10.1016/j.agwat.2014.01.006 >.
Manivannan, S., Arumugam, R., Devi, P., Paramasivam, S., Salil, P., Subbarao, B., 2010. Optimization of heat sink EMI using Design of Experiments with numerical computational investigation and experimental validation. IEEE International Symposium on Electromagnetic Compatibility (EMC) 295-300. http://dx.doi.org/10.1109/ISEMC.2010.5711288 >.
McIntosh, P., Pook, M., Risbey, J., Lisson, S., Rebbeck, M., 2007. Seasonal climate forecasts for agriculture: Towards better understanding and value. Field Crops Research, 104, 130-138. < http://dx.doi.org /10.1016/j.fcr.2007.03.019 >.
Meléndez Pertuz, F., Gonzalez Coneo, J., Comas Gonzalez, Z., Nuñez Perez, B., & Viloria Molinares, P. V. (2017). Integridad estructural de tuberías de transporte de hidrocarburos: Panorama actual. Retrieved from: http://www.revistaespacios.com/a17v38n17/17381701.html .
Michaels, P., 1982. Atmospheric pressure patterns, climatic change and winter wheat yields in North America. Geoforum, 13(3), 263-273. < http://doi:10.1016/0016-7185(82)90015-X >.
Montoya F.G., Julio Gómez, J., Cama A., Zapata-Sierra, A., De La Cruz, J.L., Manzano-Agugliaro, F., 2013. A monitoring system for intensive agriculture based on mesh networks and the android system. Computers and Electronics in Agriculture. 99, 14-20. < http://dx.doi.org/10.1016/j.compag.2013.08.028 >.
Mishra, A., Siderius, C., Aberson, K., van der Ploeg, M., Froebrich, J., 2013. Short-term rainfall forecasts as a soft adaptation to climate change in irrigation management in North-East India. Agricultural Water Management, 127, 97-106. < http://dx.doi.org/10.1016/j.agwat.2013.06.001 >.
Ndzi, D., Harun, A., Ramli, F., Kamarudin, M., Zakaria, A., Shakaff, A., Jaafar, M., Zhou, S., Farook, R., 2014. Wireless sensor network coverage measurement and planning in mixed crop farming. Computers and Electronics in Agriculture, 105, 83-94. < http://dx.doi.org/10.1016/j.compag.2014.04.012 >.
Open-Forecast, 2014. Open-Forecast Project [Available on line, accessed oct 25, 2014]. < https://sites.google.com/site/opforecast/ >.
Palmer, T.N., 2014. More reliable forecasts with less precise computations: A fast-track route to cloud-resolved weather and climate simulators? Philosophical Transactions of the Royal Society A: Mathematical, Physical and Engineering Sciences. 372(2018). < http://dx.doi.org/10.1098/rsta.2013.0391 >.
Peng, P., Wang, Q., Bennett, J., Pokhrel, P., Wang, Z., 2014. Seasonal precipitation forecasts over China using monthly large-scale oceanic-atmospheric indices. Journal of Hydrology, 519, 792-802. < http://dx.doi.org/10.1016/j.jhydrol.2014.08.012 >.
Schmidt, M., Klein, D., Conrad, C., Dech, S., Paeth, H., 2014. On the relationship between vegetation and climate in tropical and northern Africa. Theoretical and Applied Climatology 115(1-2), 341-353. < http://dx.doi.org/10.1007/s00704-013-0900-6 >.
Sung, W.T., Chen, J.H., Hsiao, C.L., Lin, J.S., 2014. Multi-sensors data fusion based on arduino board and XBee module technology. Proceedings - 2014 International Symposium on Computer, Consumer and Control, IS3C, Taiwan. Article number 6845909, pp. 422-425. http://dx.doi.org/10.1109/IS3C.2014.117>.
Taylor, 2009. 1523 Digital Indoor/Outdoor Thermometer/Hygrometer. [Available on line, accessed oct 27, 2014]. http://www.taylorusa.com/media/IBs/1523_ib.pdf
Vantage, 2012. Vantage Pro2 [Available on line, accessed oct 25, 2014]. http://www.davisnet.com/product_documents/weather/manuals/07395-240_IM_06312.pdf/>.
Varfi, M.S., Karacostas, T.S., Makrogiannis, T.J., Flocas, A.A., 2009. Characteristics of the extreme warm and cold days over Greece. Advances in Geosciences 20, 45-50.
Weber, P., Zagrabski, M., Wojciechowski, B., Nikodem, m., Kȩpa, K., Berezowski, K., 2014. Calibration of RO-based temperature sensors for a toolset for measuring thermal behavior of FPGA devices. Microelectronics Journal 1-11. http://dx.doi.org/10.1016/j.mejo.2014.06.004>.
Yan, H., Zhang, J., Hou, Y., He, Y., 2009. Estimation of air temperature from MODIS data in east China. International Journal of Remote Sensing 30(23), 6261-6275. http://dx.doi.org/10.1080/01431160902842375 />.
Yu, Q.S., Duan, M.Y., Zhang, T.S., Wu, H.G., Lu, S.K., 2014. An wireless collection and monitoring system design based on Arduino. Advanced Materials Research 971-973, 1076-1080. < http://dx.doi.org/10.4028/www.scientific.net/AMR.971-973.1076 >.
Zhang, D.F., Ma, R., Lu, H.W., Yang, C.J., Wu, G. A method of evaluating the distribution system reliability under freezing disaster weather based on the continuity of meteorological parameters. Power System Protection and Control. 2013. (22), 51-56.
Zinyengere, N., Mhizha, T., Mashonjowa, E., Chipindu, B., Geerts. S., Raes, D., 2011. Using seasonal climate forecasts to improve maize production decision support in Zimbabwe. Agricultural and Forest Meteorology, 151, 1792-1799. http://dx.doi.org/10.1016/j.agrformet.2011.07.015 >.
1. Universidad de la Costa, Barranquilla, Colombia. PhD(c) Doctorado en Ingeniería; MsC. en Ingeniería. Profesor Investigador Universidad de la Costa. gpineres1@cuc.edu.co
2. Universidad de la Costa, Barranquilla, Colombia. PhD Doctorado en Tecnología de Invernaderos e Ingeniería Industrial y Ambiental. Profesor Investigador Universidad de la Costa. Acama1@cuc.edu.co
3. Magíster en Ingeniería, Universidad de la Costa. CEO EMERGE Tecnologías. danndelarosam@gmail.com
4. University of Applied Sciences of Münster, Alemania. PhD Doctorado en Tecnologías de la Información y Comunicación. Fe018173@fh-muenster.de
5. Universidad de Granada, Escuela Técnica Superior de Ingenierías, Informática y Telecomunicaciones. MsC. en Ingeniería Insdustrial. doracamapinto@correo.ugr.es