
 Vol. 38 (Nº 35) Año 2017. Pág. 2
Juan Carlos MORALES Piñero 1; Nestor Orlando CORDERO Saenz 2; José Daniel RAMÍREZ 3
Recibido:28/03/2017 • Aprobado: 12/04/2017
ABSTRACT: In this research, we analyze the playing role of growth in the technical careers supply, salary expectations and reputation of the university on the decision to choose Industrial Engineering. The study was conducted using secondary information on wages, population and enrollment in Colombia during the years 2007-2015. The main conclusions reveal that graduates from most expensive universities tend to earn significantly higher wages than graduates of other universities. However, the high cost of education involves rates of return much lower than those of universities cheaper. |
RESUMEN: En esta investigación analizamos el papel que juegan la ampliación de la oferta, las expectativas salariales y la reputación de la universidad sobre la decisión de elegir Ingeniería Industrial. El estudio se realizó utilizando información secundaria de los salarios, la población y matriculados en Colombia durante los años 2007 - 2015. La principal conclusión revela que los egresados de universidades costosas tienden a ganar mayores salarios que el resto a medida que pasa el tiempo, aunque la alta inversión que supone los estudios hace que tenga tasas de retorno mucho menores. |
The transition from secondary education to higher education involves for students a decision that defines their occupational future in their adolescence (Villada et al., 2002). Given the psychological insecurity that the student faces, this decision may be influenced by factors such as family beliefs, social reputation, salary expectations, among others (Ghansah et al., 2016; Martin, Simmons, & Yu, 2014; Taylor, 2007).
In this sense, (Carnasciali, Thompson, & Thomas, 2013) analyze the influence of socializers, self-identified competence, and media sources on choosing a career and indicate that gender and parental educational achievement levels affect students’ choice of engineering. As well, (Piñero Ramírez, 2015) in his research on the Rational Action Theory concludes that individual characteristics (e.g., social origin, sex and school history) are the main factor that determines the career choice. Specifically in Bogota, we find the study of (Pineda Barón, 2015) who using a Logit Multinomial Model, concludes that this the career choice depends on the genre, mother's education, family income, and the results of Saber 11 Test and wage expectations.
On the other hand, when the option of studying at a public university not is available, families need financial assistance to pay the cost of higher education; this involves the uncertainty of whether or not such investment will be worthwhile. In addition, there is a latent question—tacitly or explicitly—of how many years the student will be attending higher education before getting into the job market.
Likewise, choosing a specific university can be an important decision for the candidate. In this context, we find the study of (Dunnett, Moorhouse, Walsh, & Barry, 2012) who examines the impact of fee changes on how students weigh up their university choices. They affirm that “students from families where there is no history of attending university will experience more disutility from the higher fees” (p.199)
Specifically, in the case of young people who wish to study Industrial Engineering, several questions can be arising such as follows: should they pursue a technical or a university degree? Which university should they choose? Will become a worthwhile investment? In this research, we analyze the influence of an increase in the offer of technical careers, student´s salary expectations and the reputation of the university on the decision to choose Industrial Engineering as a professional alternative in Colombia.
The study was made using secondary information of private Colombian universities obtained from (Observatorio Laboral -MEN, 2015), looking for salary information, from (DANE, 2015) for population statistics, and from (SNIES- MEN, 2015) for enrollments information. We analyzed the available data for the period 2007 – 2015.
The variables analyzed were: number of enroll students, career, number of industrial engineering programs, universities, affordability, graduate incomes, wage increase per year of experience, employability rate.
The first stage consisted of evaluating the growth of technical and technological careers in relation to university careers during the study period in order to evaluate the trend in the preference of high school graduates.
Later, the study focused on the area of industrial engineering and we compare the average wage (in current Colombian pesos COP) of a graduate in technical or technology career with the average wage of a university graduate. In this case, the variable wage was built on the average monthly salary reported each year and it was adjusted based on the years of experience of the graduate.
The next stage of the analysis was focused on the students enrolled in Industrial Engineering in 51 private Colombian universities for which complete information was available. For this purpose, the universities were grouped by cluster analysis based on the tuition cost of the year 2014. The cluster analysis was applied using the SPSS software and three groups/clusters were defined: 12 universities were grouped as the most expensive, 22 universities at intermediate cost and 17 universities as economic.
Subsequently, students’ preference for these three types of universities was analyzed according to the number of students who applied, were admitted and enrolled in Industrial Engineering by universities over the study period. This was done to compare the salary differences in relation to the cost of the tuition of the institution where students attended the course.
Finally, an economic analysis of the alternative of studying Industrial Engineering was carried out in a horizon of 10 years since the student enrolls in the career until he completes 5 years working as a graduate; that is, we assume a scenario of 5 years studying and 5 years working. The investment in the studies was calculated on the basis of the tuition fee reported by the universities for the year 2014 and this value was adjusted annually assuming an annual inflation rate of 5%. Revenues were calculated since the sixth year on the basis of the average salary of a graduate of the year 2014 adjusted for inflation in the previous 5 years. From year 7, the salary was annually adjusted based on the growth rate of the experience curve. The monetary values are expressed in Colombian Pesos (COP).
The discount rate used was the lowest market charged by the (ICETEX, 2017) that was 3.66% for the year 2014. This rate only applies to poor students, who technically could only apply to affordable universities. However, to carry out the study under equal conditions, in all cases ICETEX rate was applied. After calculating the cash flows for each year and university, the net present value and the internal rate of return on investment were calculated.
To carry out the study, the first step was to examine the evolution of access to higher education in Colombia. For that, the population enrolled in universities and in technical and technology careers in the period 2007-2015 was evaluated. This population was contrasted with the population of the country between the ages of 17 and 21, which are the age at which young people enter higher education (see Table 1).
Table 1: Coverage of higher education in Colombia
Enrolled per year |
Total Enrolled per year |
Population between 17 and 21 years |
Coverage rate |
||
Year |
Technical and technology education |
University Education |
|||
2007 |
395.437 |
910.228 |
1.305.665 |
4.125.881 |
31,65% |
2008 |
463.980 |
963.167 |
1.427.147 |
4.187.317 |
34,08% |
2009 |
498.382 |
1.015.608 |
1.513.990 |
4.241.585 |
35,69% |
2010 |
542.627 |
1.045.133 |
1.587.760 |
4.284.916 |
37,05% |
2011 |
586.471 |
1.159.512 |
1.745.983 |
4.319.415 |
40,42% |
2012 |
593.684 |
1.218.816 |
1.812.500 |
4.342.603 |
41,74% |
2013 |
670.930 |
1.296.123 |
1.967.053 |
4.354.649 |
45,17% |
2014 |
711.291 |
1.369.149 |
2.080.440 |
4.356.453 |
47,76% |
2015 |
717.521 |
1.431.983 |
2.149.504 |
4.349.823 |
49,42% |
Source: SNIES - MEN, DANE
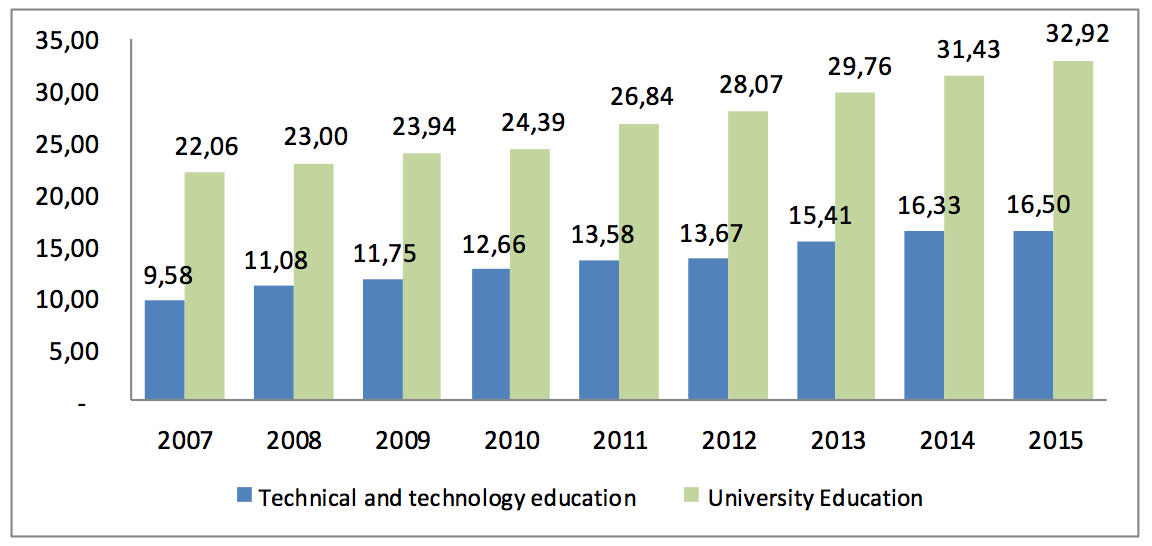
With this information was calculated the rate of coverage of higher education in Colombia differentiated by technical, technology and university education. The results shown in figure 1 indicate that in the group of people who opt for higher education, the university remains in time as the principal option.
Figure 1: Coverage rate by Institution

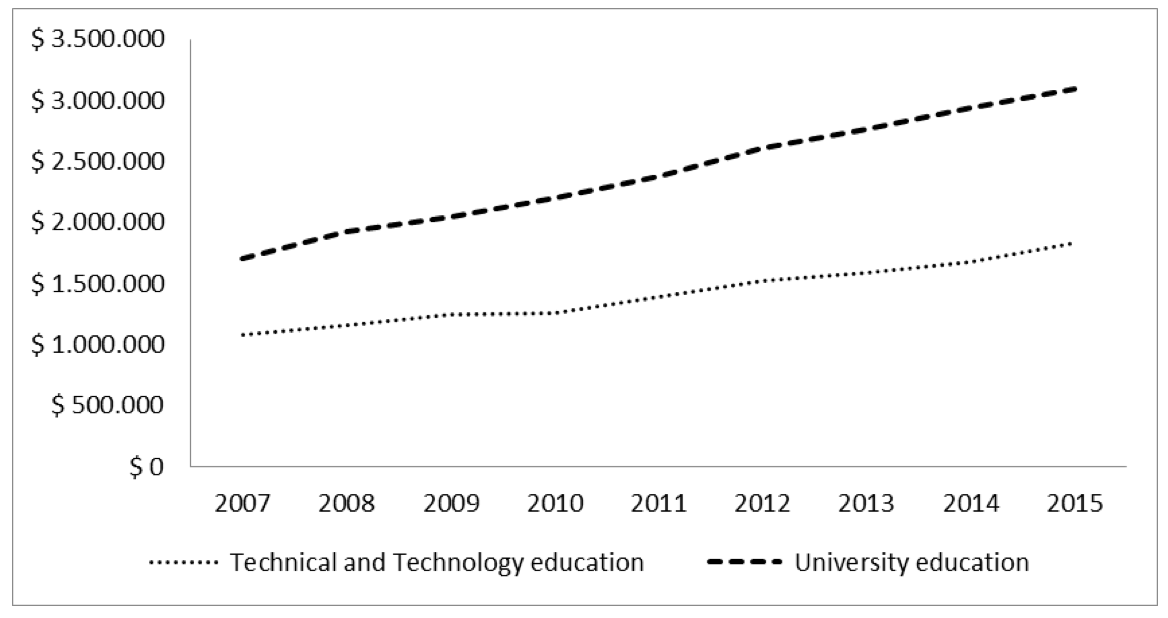
This information allowed the analysis of the evolution in average salaries of graduates of technical and technological careers and of universities in areas related to industrial engineering during the study period (see Figure 2). The analysis shows that not only the salaries of university graduates are much higher than that of technical career graduates, but that this tends to increase in a greater proportion over time. This can be an element that discourages the preference for technical and technological careers.
Figure 2: Undergraduate average wage in COP

After analyzing the differences between technical and university graduates, the focus was on evaluating the behavior of the market segment that is inclined to study Industrial Engineering in Colombia in private universities. To do this, a cluster analysis was initially carried out to classify universities according to the value of tuition for 2014 (see Table 2).
Table 2: Industrial engineering career by university tuition fee
Cluster Number |
Average Tuition fee in 2014 * |
Average wage in 2014 * |
|
More Expensive |
Mean |
7.064.476 |
2.033.856 |
Standard deviation |
2.302.656 |
290.245 |
|
N |
12 |
12 |
|
Minimum |
5.057.350 |
1.573.126 |
|
Maximum |
13.144.000 |
2.419.651 |
|
Intermediates |
Mean |
3.788.760 |
1.698.348 |
Standard deviation |
470.704 |
267.856 |
|
N |
22 |
22 |
|
Minimum |
3.184.000 |
1.300.667 |
|
Maximum |
4.780.000 |
2.440.914 |
|
Cheapest |
Mean |
2.479.698 |
1.766.226 |
Standard deviation |
348.473 |
288.684 |
|
N |
17 |
17 |
|
Minimum |
1.599.950 |
1.205.750 |
|
Maximum |
2.910.000 |
2.147.820 |
|
* Values in COP |
|||
On the basis of the classification, stand out the most expensive group of universities because they have the greatest dispersion in the data, since the value of the standard deviation represents more than one-third of the mean. Once the classification was made, the evolution of the Industrial Engineering stakeholders in each type of university was analyzed, separated by phases of the process. It is important to stress that in Colombia for an applicant to enter a university must submit his application to be evaluated by examinations and / or interviews. Once that phase passes, the candidate is advised of the admission to the program, but not all those who are admitted eventually enroll because it usually happens that they run for several universities.
Table 3: Number of Industrial Engineering students by process stage
University by tuition fee |
Students by process |
2007 |
2008 |
2009 |
2010 |
2011 |
2012 |
2013 |
2014 |
2015 |
More Expensive |
Students who applied |
4924 |
5169 |
5458 |
4877 |
5276 |
5598 |
5495 |
5465 |
6385 |
Acknowledged Students |
3014 |
3632 |
3747 |
3180 |
3947 |
4047 |
4174 |
4174 |
4473 |
|
Enrolled Students |
2320 |
2126 |
2384 |
2209 |
2290 |
2289 |
1995 |
2106 |
2476 |
|
Intermediates |
Students who applied |
4482 |
6218 |
6014 |
6091 |
6968 |
7247 |
9082 |
8601 |
8487 |
Acknowledged Students |
3742 |
5170 |
4688 |
4619 |
5872 |
5179 |
6054 |
6133 |
6620 |
|
Enrolled Students |
3483 |
4024 |
3694 |
3569 |
4873 |
4123 |
4733 |
4799 |
4836 |
|
Cheapest |
Students who applied |
2070 |
1933 |
2648 |
2738 |
3428 |
3803 |
3707 |
4371 |
4202 |
Acknowledged Students |
1943 |
1659 |
2340 |
2354 |
2903 |
2871 |
3031 |
3309 |
3108 |
|
Enrolled Students |
1411 |
1800 |
1549 |
1608 |
1873 |
2114 |
2496 |
2782 |
2740 |
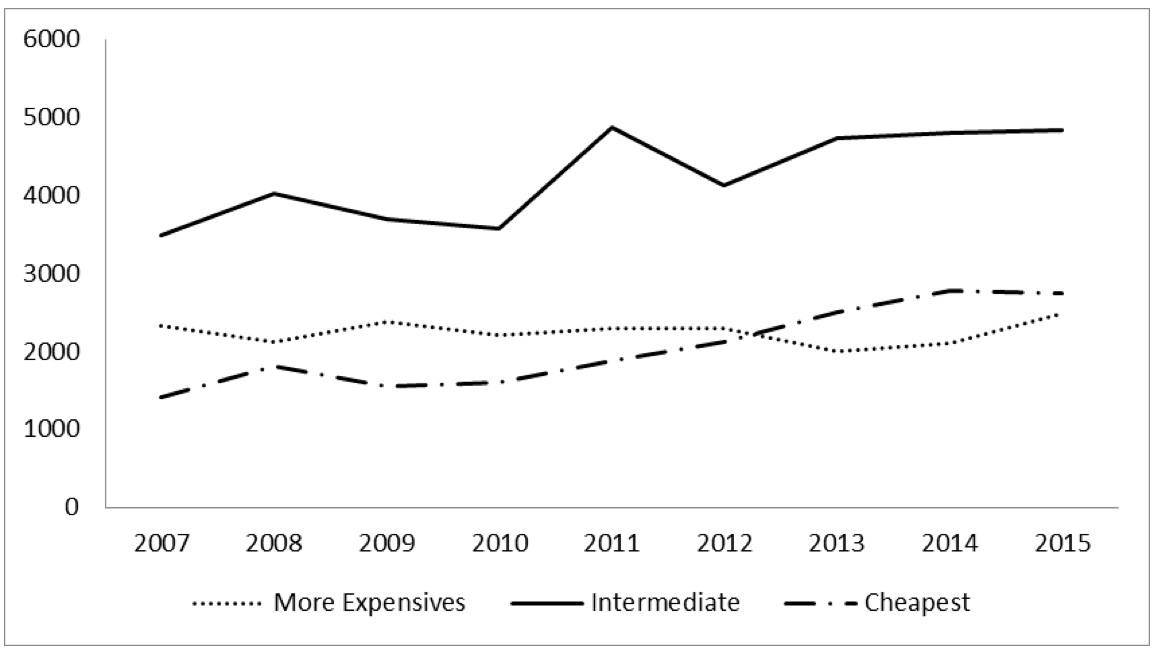
In figure 3 the evolution of the number of Industrial Engineering students during the study period classified by the tuition fee is showed. It is clear that universities at a cost of intermediate tuition cost capture the largest proportion of the market and maintain a positive trend. It is also observed that the cheaper universities maintain a growing trend, and 2013 began to capture a greater proportion than the more expensive universities. Besides, the most expensive universities have been stable in the time managing between 2000 and 2500 students per year.
Figure 3: Enrolled students in industrial engineering by university tuition fee

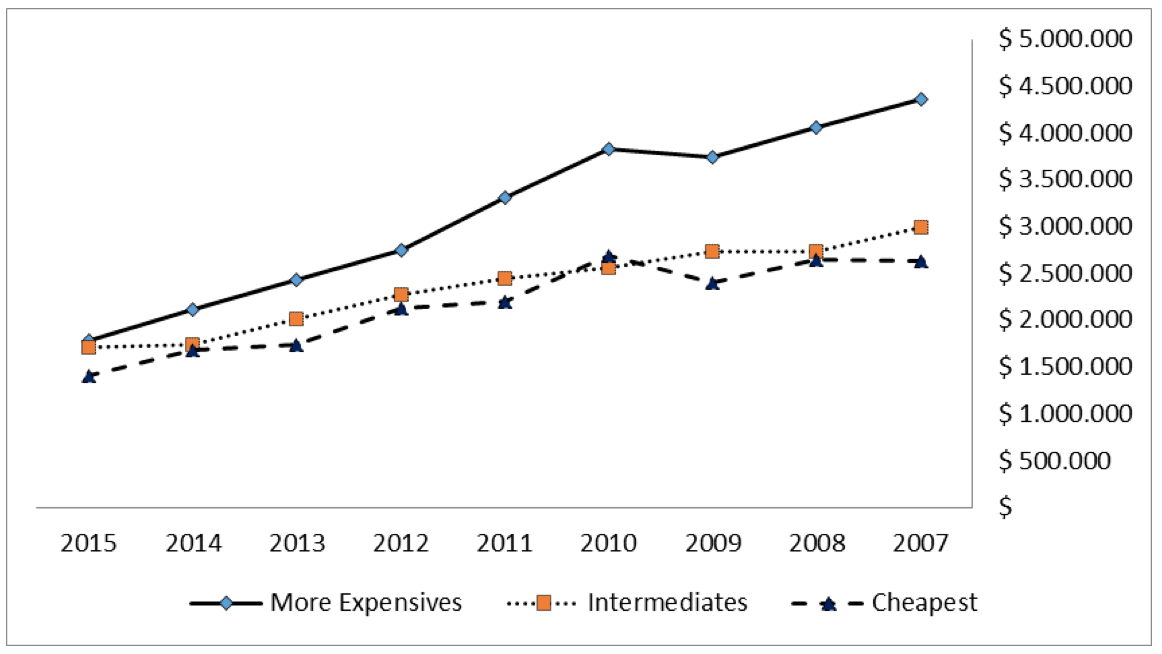
On the other side, from the information previously shown in Table 2, it is observed that the average salary received by the new graduate for the year 2014 is not necessarily directly related to the cost of enrollment. Also, there is no significant difference in the average salary of the recent graduate. To evaluate the behavior over time of this variable, we performed this analysis during the study period but comparing the average salary for the year 2015 (Y axis) depending on the year of graduation (X axis) (see Figure 4).
Figure 4: Wage in 2015 by year of graduation in COP

As showed in figure 4, there are no significant differences in the salaries of the recent graduates, but as time goes on, graduates from more expensive universities tend to earn significantly higher salaries than graduates of other universities. On the other hand, graduates of universities with intermediate or cheap tuition fees tend to receive equivalent salaries as the years pass.
In order to evaluate the economic scenario that has a candidate of Industrial Engineering in Colombia based on the information analyzed so far, an economic analysis of the investment that a person has to make in his career was made, taking as a temporal horizon 10 years from the beginning of study. The cash flows obtained, the net present value of the investment and the internal rate of return were calculated as showed in table 4.
Table 4: Economic expectation for an industrial engineering in Colombia
University by tuition fee |
||||
More Expensive |
Intermediates |
Cheapest |
||
Average tuition fee in COP (2014) |
7.064.476 |
3.788.760 |
2.479.698 |
|
Tuition fee* |
12,07 |
6,15 |
4,02 |
|
Average wage in COP (2014) |
2.033.856 |
1.698.348 |
1.766.226 |
|
Employability rate |
87,51 |
84,03 |
82,27 |
|
NPV** in COP (10 years) |
79.167.418 |
86.999.412 |
104.934.732 |
|
IRR *** in COP (10 years) |
20,98% |
30,98% |
43,51% |
|
Tuition fees during the career in COP |
Year 1 |
-14.128.952 |
-7.577.520 |
-4.959.396 |
Year 2 |
-14.835.399 |
-7.956.396 |
-5.207.366 |
|
Year 3 |
-15.577.169 |
-8.354.216 |
-5.467.734 |
|
Year 4 |
-16.356.028 |
-8.771.927 |
-5.741.121 |
|
Year 5 |
-17.173.829 |
-9.210.523 |
-6.028.177 |
|
Income in the first graduate years in COP |
Year 6 |
31.149.279 |
26.010.848 |
27.050.425 |
Year 7 |
35.487.594 |
29.633.509 |
30.817.872 |
|
Year 8 |
40.712.756 |
33.996.720 |
35.355.469 |
|
Year 9 |
44.491.848 |
37.152.408 |
38.637.280 |
|
Year 10 |
48.235.981 |
40.278.904 |
41.888.732 |
|
* In number of minimum wage in 2014; ** Net Present Value; *** Internal Rate of Return |
||||
As can be noted, although the people who study industrial engineering in the most expensive universities earn significantly higher wages over time than the rest of the graduates, the high investment involved in the studies makes the return rates much lower than the rest.
It is important to note here that if a differentiated rate is applied to the market, the gap would be much higher, perhaps leading to economic advice do not recommend to study in an expensive university. Finally, it can be observed that the most economically profitable option is offered by studies in the cheapest universities. Besides, it is observed that the employability rate is equivalent to any of the universities.
From the research carried out, it can be concluded that although the number of students enrolled in technical and technological careers tends to grow in proportional form to those enrolled in universities, the average wage received by university graduates tends to increase in a higher proportion in the long-term.
It is also observed that universities with an intermediate tuition cost capture the largest proportion of the market and hold an increasing trend throughout the study.
Although there are no significant differences in the wages of just industrial engineering graduates, graduates of more expensive universities tend to earn significantly higher wages than graduates of other universities over time. However, the high cost of studies in those universities makes the investment have rates of return much lower than the rest of universities.
Carnasciali, M.-I., Thompson, A. E., & Thomas, T. J. (2013). Factors influencing students’ choice of engineering major. In ASEE Annual Conference and Exposition, Conference Proceedings (p. 36).
DANE. (2015). Proyecciones de población. Retrieved February 4, 2017, from http://www.dane.gov.co/index.php/estadisticas-por-tema/demografia-y-poblacion/proyecciones-de-poblacion
Dunnett, A., Moorhouse, J., Walsh, C., & Barry, C. (2012). Choosing a University: A conjoint analysis of the impact of higher fees on students applying for university in 2012. Tertiary Education and Management, 18(3). http://doi.org/10.1080/13583883.2012.657228
Ghansah, B., Benuwa, B.-B., Ansah, E. K., Ghansah, N. E., Magama, C., & Ocquaye, E. N. N. (2016). Factors that influence students’ decision to choose a particular university: A conjoint analysis. International Journal of Engineering Research in Africa, 27, 147–157. http://doi.org/10.4028/www.scientific.net/JERA.27.147
ICETEX. (2017). Crédito a largo plazo - 0%. Retrieved March 1, 2017, from https://www.icetex.gov.co/dnnpro5/es-co/créditoeducativo/pregrado/cortoplazo100porciento.aspx
Martin, J. P., Simmons, D. R., & Yu, S. L. (2014). Family roles in engineering undergraduates’ academic and career choices: Does parental educational attainment matter. International Journal of Engineering Education, 30(1).
Observatorio Laboral -MEN. (2015). Consultas Avanzadas - liferay.com. Retrieved February 4, 2017, from http://bi.mineducacion.gov.co:8380/eportal/web/men-observatorio-laboral/consultas-avanzadas
Pineda Barón, L. A. (2015). Factores que afectan la elección de carrera: caso Bogotá. Vniversitas Económica, 15(3), 1–35.
Piñero Ramírez, S. L. (2015). Factores asociados a la selección de carrera: una aproximación desde la Teoría de la Acción Racional. Revista de Investigación Educativa, 20(enero-junio), 72–99.
SNIES- MEN. (2015). Sistemas de información. Retrieved February 4, 2017, from http://www.mineducacion.gov.co/sistemasdeinformacion/1735/w3-article-212400.html
Taylor, D. (2007). Employment Preferences and Salary Expectations of Students in Science and Engineering. BioScience. http://doi.org/10.1641/B570212
Villada, C. A., Lopez, L. M., Patiño, C. D., Ramirez, W., Jurado, C. M., & Ossa, J. (2002). Factores asociados a la elección de carrera y universidad. Unipluriversidad, 2(2), 23–30.
1. Ph.D. in entrepreneurship and management, Specialist's degree in logistics operations. Research Professor in the Industrial Engineering Program. Universidad Sergio Arboleda, Colombia. Email: juancar.morales@correo.usa.edu.co
2. Master's degree in agribusinesses. Professor in the Industrial Engineering Program. Universidad Sergio Arboleda, Colombia. Email: nocordero@yahoo.com
3. Industrial Engineering student. Universidad Sergio Arboleda, Colombia. Email: danielrac14@hotmail.com